What we do
The Virtual Twin: shared through the Common Domain, it gives every stakeholder the same photorealistic view of the landscape.
The Erca Engine: working beneath the twin, it models how the land will respond to proposed changes.
The Common Domain
Landscape change often involves several stakeholders, including planning authorities, environmental or wildlife agencies, government departments and water companies. Traditionally, each organisation has worked separately, even though every decision can create knock-on effects for the others. The result is confusion, mistakes and conflict.
The Common Domain brings every organisation into the same model. Each group uses simple, familiar tools, while every proposed intervention appears for everyone in a single photorealistic 3D view. Because the Virtual Twin is intuitive, users can understand and explore it with minimal training.
The Virtual Twin includes tools designed for specific users. A water company, for example, can use available data to test new infrastructure and map water flow and quality, including agricultural runoff, flood risk and extreme-weather scenarios.
Forestry agencies and farmers can identify suitable planting locations, assess practical constraints such as machinery access and shading, model growth, and visualise the landscape five or ten years into the future. They can also add measures such as carbon sequestration and timber production.
Instead of interpreting a technical proposal in isolation, every stakeholder can see the same change in context. Its location, scale and likely effects are immediately clear, reducing misunderstanding and helping teams make informed decisions together.
Why a photorealistic visual image?
Vivid uses Epic Games’ Unreal Engine to create a detailed, live and interactive 3D world. This provides the foundation for integrating boundaries, LiDAR, physical features, vegetation and other data. Using a leading, games-quality platform lets us focus our resources on modelling the landscape rather than recreating proven visual technology.
Photorealistic rendering helps users trust that they are seeing a credible picture of the future. That matters particularly for landowners, who may be cautious about new technology and change. Many know their landscapes intimately and want clear, convincing evidence before adopting a different approach.
The result is an accessible and enjoyable experience with a serious analytical purpose. Vivid can absorb vast amounts of data, predict outcomes, simulate multiple scenarios instantly and share them through the Common Domain across several screens at once, from a laptop on the farm kitchen table to a council or land agent’s office.
Why visual
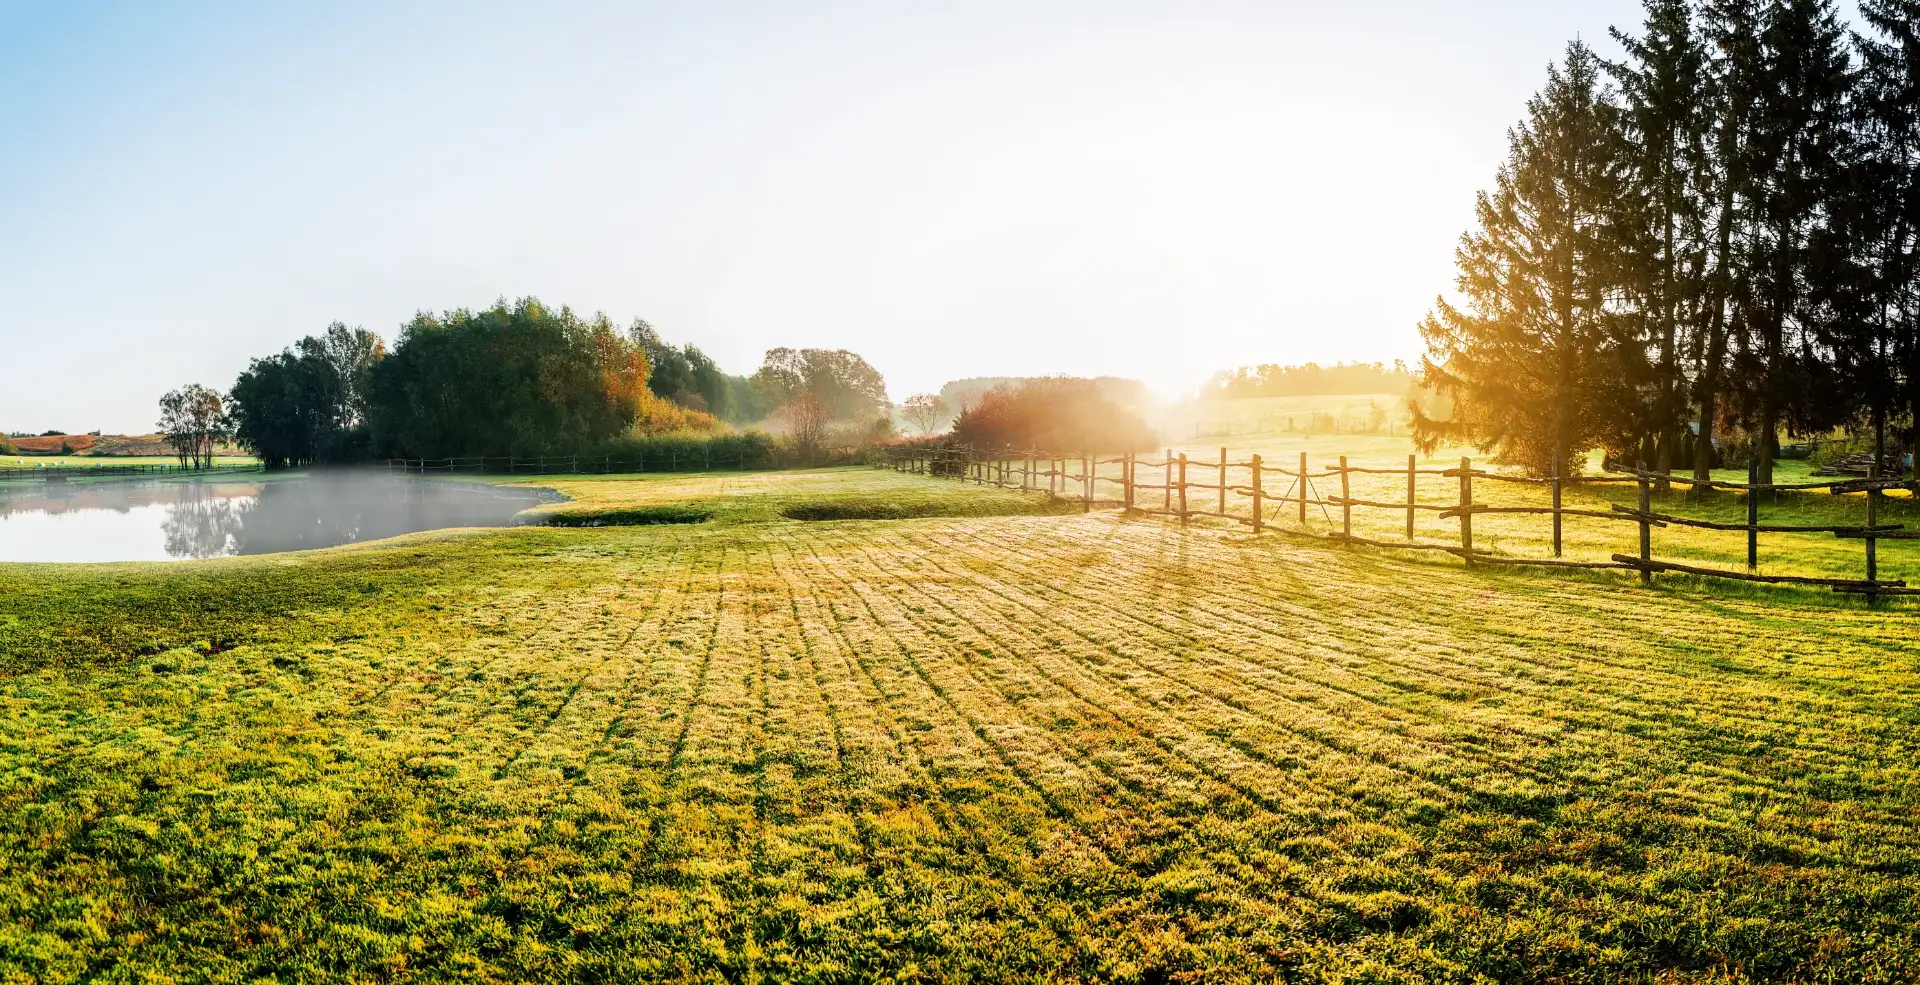
By reducing everything to a visual, photorealistic rendering of the data and the proposed change, complex ideas land in an instant.
The Erca Engine
The twin is what you see; Erca is what drives it. Working hour by hour and square by square, the engine models how water, soil, carbon, nitrogen and plants interact, so every decision reflects how the landscape actually behaves.
Projects like this have traditionally relied on models fitted to patterns observed elsewhere, then applied to land they were never designed for. The results inherit those original assumptions, often without showing where or how they influence the outcome.
Erca starts with the processes themselves:
Each process is modelled as a separate module that can change only its own quantities. The interactions between modules emerge from the land itself rather than being assumed in advance. The result is a clearer picture of how the system will behave, and a foundation every stakeholder can trust.
How Erca works
Erca models the landscape at two connected scales.
Space: the land is divided into 10 m squares, each with six soil layers extending to a depth of 1.5 m.
Time: fast-moving processes, including weather, water and soil movement, are calculated every hour, while slower processes such as plant growth, soil carbon and soil structure are updated daily.
Each square maintains its own balance sheet. Every millimetre of rain, and every gram of carbon, nitrogen and soil, must be accounted for after each step. This ensures that nothing is created or lost unintentionally.
High-resolution LiDAR captures the terrain’s slope, aspect and shading, as well as the routes water follows downhill. Runoff therefore travels through real channels, cold air settles in real hollows, and individual trees are identified one by one.
Soil structure changes over time. Roots and soil organisms create pores and bind particles together, while heavy rain can close those pores again. As plant growth improves soil health, runoff and erosion decline, just as they do in a real field.
Calibration: Erca is calibrated against satellite imagery showing how vegetation greens up and dies back.
Validation: it is then tested against different years and river records that it has never encountered. These independent datasets are held back as a genuine test of performance.
Every input is classified as measured, modelled, derived or assumed, and that classification is carried through to the results. Erca also runs multiple versions side by side, showing not only the answer but how confident users can be in it.
Every design begins from the same saved state of the land, like dividing one field into identical plots on the same day. Predictions are recorded before the results are reviewed, preventing outcomes from being reinterpreted after the event.
What Erca powers
The Virtual Twin shows the land; Erca calculates how it will respond. By powering the data beneath the Common Domain, Erca ensures that every stakeholder sees outcomes derived consistently from the same evidence.
Track where rain goes: how much soaks into the ground, how much runs off, and what reaches rivers, including during storms.
Measure carbon gained or lost, nitrogen retained or washed away, and soil displaced by water, square by square.
Model how grass and trees grow through the seasons, and identify where wild bees can find food and nesting habitat.
Propose a change, from tree planting to earthworks that slow water on a slope, and Erca reruns the years to reveal its effects. The results are then ready to share across the Common Domain.
How we test it
19%
lower prediction error on previously unseen years after training on Sentinel-2 satellite data
~150
variables tracked in every 10 m square across hourly, daily and monthly cycles
10 years
of hourly weather replayed square by square for every modelled site
We test Erca against data that was never used to tune it. Its simulated annual water balance agrees with gauged river flows in the surrounding catchments to within a few per cent.
Every result includes a range. As site-specific soil samples and sensor readings become available, they replace global soil maps. Erca also identifies where the next measurement would add the most value.
Beyond simulation
Erca is a decision tool for farmers, land managers and designers. It models proposed changes on your land before anything changes on the ground, helping teams compare options, understand trade-offs and plan with greater confidence.
Test conventional, minimum-tillage, organic, silvopasture and mixed cattle-and-arable systems using presets or your own farm diary. Each scenario projects yields, soil carbon, erosion, water and economic outcomes, with uncertainty ranges.
Compare Keyline+ and contour earthworks with taking no action before anything is built. See how each design interacts with farm practices, physical outcomes and costs.
Map power lines, pylons and pipes; optimise tanks, pumps and pipe routes; and assess the rainwater and solar potential of every roof.
Model field fire danger and spread, fire movement between buildings, and exposure to extreme winds.
Identify where an additional soil sample or sensor would improve Erca’s understanding most.
Stream hourly and daily map layers, realistically shaped 3D trees and hedges, and weather and seasonal conditions from the same model run into the Vivid Virtual Twins built in Unreal Engine. What appears in the twin is what the science predicts.
Why Erca?
Erce, Erce, Erce, eorþan modor
Erce, Erce, Erce, mother of earth
The name comes from Erce, the earth mother called on three times in the Æcerbot, an Old English field-blessing charm written down in the early eleventh century. Farmers spoke it over land that had stopped giving, to bring its fertility back.
A thousand years on, Erca has the same purpose, grounded in data rather than ritual: understanding the land well enough to help it give back more than it takes.
Built on open science
Talk to us about modelling your land, and what it could show you and everyone involved before you change a thing.